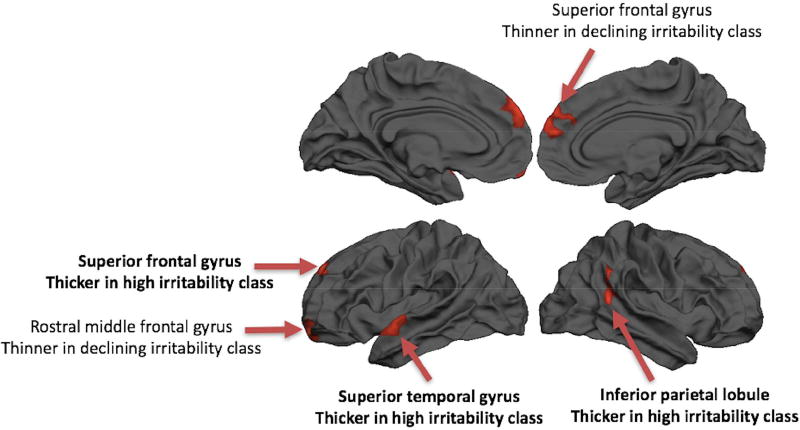
Figure 2. Regions showing differences in cortical thickness by trajectory class.
Note: Five regions showing differences in the temporal average of cortical thickness across wave as a function of irritability trajectory class are displayed. Regions showing greater thickness among the high irritability class are denoted in bold.

