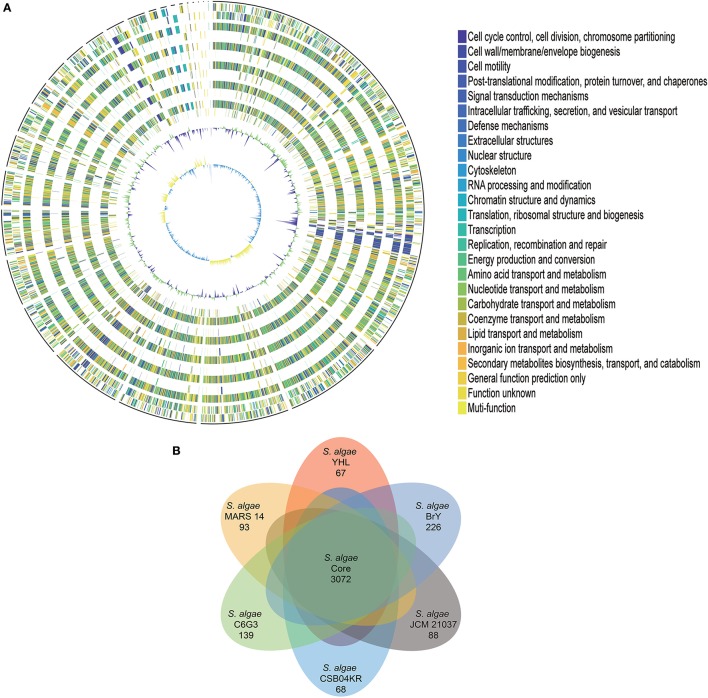
Figure 1.
Gene orthology analyses between S. algae YHL, S. algae MARS 14, S. algae JCM 21037, S. algae C6G3, S. algae BrY, S. algae CSB04KR. (A) Circles show from the outermost to the innermost: 1. DNA coordinates. 2,3 Function-based color-coded mapping of the CDSs predicted on the forward and reverse strands of the S. algae YHL genome, respectively. 4. Orthologous CDSs shared between S. algae YHL and S. algae BrY. 5. S. algae YHL-specific CDSs, compared with S. algae BrY. 6. Orthologous CDSs shared between S. algae YHL and S. algae C6G3. 7. S. algae YHL-specific CDSs, compared with C6G3. 8. Orthologous CDSs shared between S. algae YHL and S. algae CSB04KR. 9. S. algae YHL-specific CDSs, compared with S. algae CSB04KR. 10. Orthologous CDSs shared between S. algae YHL and S. algae JCM 21037. 11. S. algae YHL-specific CDSs, compared with S. algae JCM 21037. 12. Orthologous CDSs shared between S. algae YHL and S. algae MARS-14. 13. S. algae YHL-specific CDSs, compared with S. algae MARS 14. 14. GC plot depicting regions above and below average in green and violet, respectively. 15. GC skew showing regions above and below average in yellow and light blue, respectively. (B) Illustration showing the number of CDSs shared between the six strains. Core (blue) and strain-specific (skyblue) genome size of S. algae.

