
Figure 2.
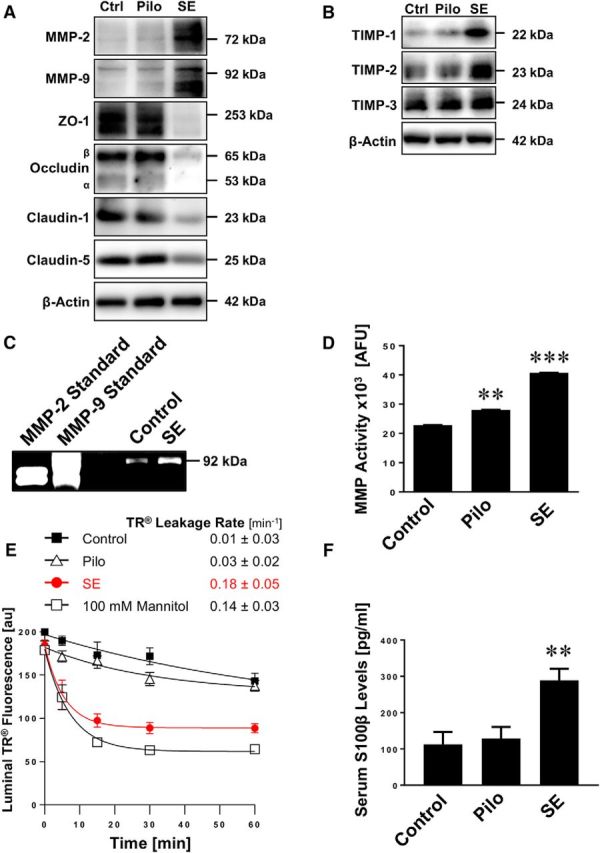
SE increases MMP levels, decreases levels of tight junction proteins, and causes barrier leakage in brain capillaries. A, Western blot showing MMP-2, MMP-9, ZO-1, occludin, claudin-1, and claudin-5 in isolated brain capillaries from rats after an SE induced with pilocarpine, rats that received pilocarpine but did not develop an SE (Pilo), and untreated control rats (Ctrl). β-Actin was used as protein loading control. B, Western blot showing TIMP-1, TIMP-2, and TIMP-3 protein expression in isolated brain capillaries from control, pilocarpine, and SE rats. C, Representative MMP-9 gelatin zymogram of brain capillary lysates from rats after SE and from control rats. Left, Positive controls from recombinant expressed MMP-2 and MMP-9. D, Total MMP enzyme activity in brain capillaries isolated from control rats, rats that received pilocarpine but did not develop an SE (Pilo), and rats after an SE was measured using the fluorogenic substrate Mca-PLGL-Dpa-AR-NH2. ***SE significantly higher than control, 1.8-fold (t(2) = 78.6, p = 0.0002; ANOVA post hoc test); Pilo significantly higher than control, 1.2-fold (t(2) = 19.0, p = 0.0028; ANOVA post hoc test); n = 2 independent experiments. E, Texas Red (TR) leakage from capillaries of rats after an SE induced by pilocarpine (SE), rats that received pilocarpine but did not develop an SE (Pilo), and untreated control rats with or without high osmotic mannitol used as positive control for barrier opening. Data are mean ± SEM for n = 7 capillaries per time point from one brain capillary isolation with n = 10 rats. Shown are 0–255 AFU. First-order efflux rates were calculated using nonlinear regression. F, S100β levels in serum samples from control rats, rats that received pilocarpine but did not develop an SE (Pilo), and rats after an SE was determined by ELISA. **Control versus SE: t(2) = 3.79, p > 0.0012; Pilo versus SE: t(2) = 3.58, p > 0.002 (ANOVA post hoc tests). n = 2 independent experiments.