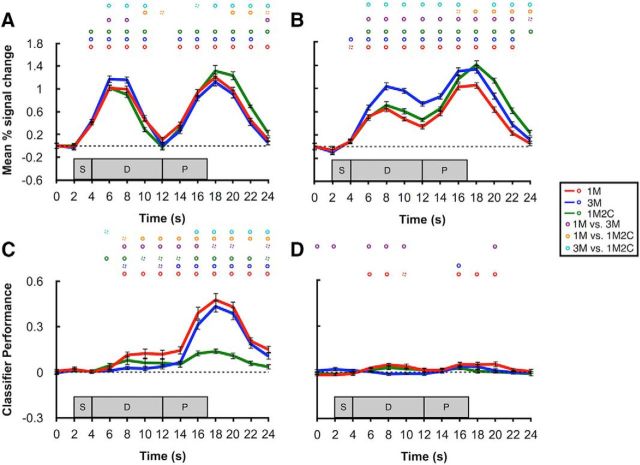
Figure 2.
BOLD activity and classification performance in sample and delay ROIs. A, Time course of BOLD activity in occipital sample ROI. B, Time course of BOLD activity in parietal delay ROI. C, Time course of classifier performance in occipital sample ROI. D, Time course of classifier performance in parietal delay ROI. Red, blue, and green lines indicate the 1M, 3M, and 1M2C conditions, respectively. Circles on top of each plot represent significance of each time point. Purple, orange, and cyan circles represent the comparisons of 1M versus 3M, 1M versus 1M2C, and 3M versus 1M2C, respectively. Solid circles represent p < 0.05. Dashed circles represent p < 0.10. All p values were corrected with false discovery rate. Shaded gray areas represent the timing of the sample (S), delay (D), and probe (P) epochs of each trial. Error bars indicate ±1 SEM.

