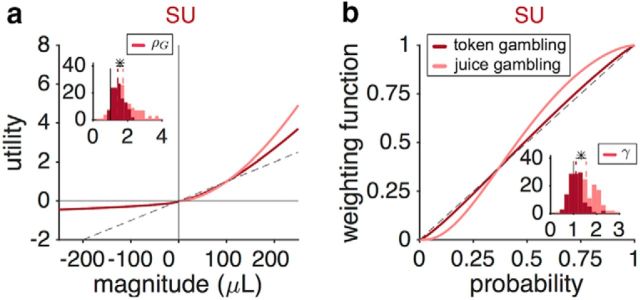
Figure 11.
Comparison of the estimated utility and PW functions in the juice-gambling and token-gambling tasks based on the SU model with DW. a, Estimated utility functions based on the best SU model with DW in the juice-gambling and token-gambling tasks. Plot shows the utility curves based on the median of the fitting parameter in the juice (pink) and token (magenta) gambling tasks. The dashed line is the unity line normalized by 100 μL. The insets show the distributions of estimated parameters for the utility curve for gains (ρG) in the two tasks. The dashed lines show the medians. There was a small but significant difference between the two distributions (two-sided Wilcoxon rank-sum test; p < 0.05). b, Estimated PW function based on the SU model with DW in the juice-gambling and token-gambling tasks. Plot shows the PW functions based on the median of the fitting parameter in the two tasks. The dashed line is the unity line. Other conventions are the same as in a. The star indicates that the medians of the two distributions are significantly different (two-sided Wilcoxon rank-sum test; p < 0.05). Correlations between estimated model parameters are plotted in Figure 11-1 and Figure 11-2 and errors in the estimation of model parameters are shown in Figure 11-3.

