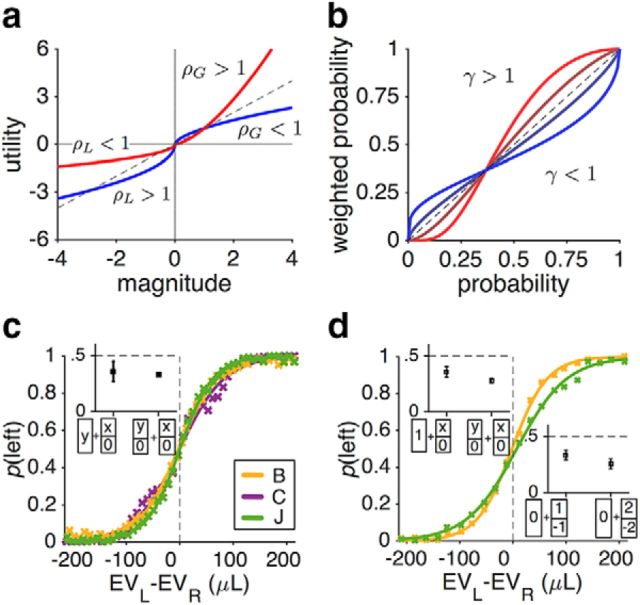
Figure 3.
Standard and nonstandard evaluation of reward magnitude and probability according to prospect theory and the overall sensitivity of monkeys' choice behavior to the difference in EVs of gambles on each trial. a, Utility function quantifying the relationship between reward magnitude and SU. Plotted in blue is a hypothetical, standard utility function based on prospect theory with concave and convex curves for gains and losses, respectively. In contrast, the red curve shows a utility function that is convex for gains and losses, resulting in risk-seeking behavior for both gains and losses and thus violating the reflection effect. Parameters ρG and ρL are the exponents of the power law used to generate the utility curves for gain and loss domains, respectively. b, PW function quantifying the transformation of actual reward probability for making decisions. Plotted are several possible shapes of PW. Prospect theory predicts inverse-S-shaped weighting functions (blue curves). Parameter γ determines the curvature of the function. c, Psychometric functions in two monkeys during the juice-gambling task. Probability of choosing the left target is plotted as a function of the difference in EVs of two gambles in a given trial. The inset plots the probability (mean ± SEM) of choosing a sure option against a gamble with an equal EV (n = 32 trials) and the probability of choosing the less risky option in pairs of gambles with equal EVs (n = 717 trials). d, Same as c, but for the token-gambling task. The top inset plots the probability of choosing the sure option of one token against a gamble with an equal EV (n = 69 trials) and the probability of choosing the less risky option in pairs of gambles with equal EVs (n = 271 trials). The bottom inset plots the probability of choosing the sure option with no reward over a 50/50 gamble of winning and losing one (n = 55 trials) or two tokens (n = 62 trials).

