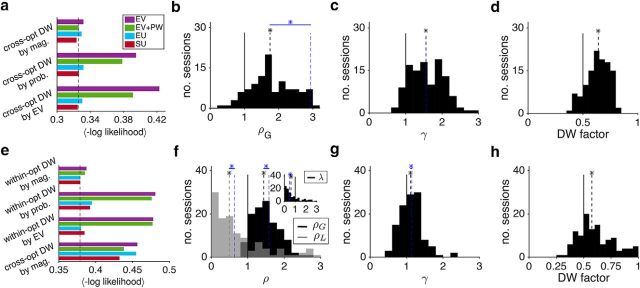
Figure 9.
DW of gamble outcomes can account for part of the convexity of the utility functions. a, Comparison of the goodness-of-fit for choice behavior during the juice-gambling task using four different models for the construction of reward value for each possible outcome (convention the same as in Fig. 6) and three different types of DW mechanisms (cross-opt: cross-option). Plotted is the average negative log likelihood (−LL) per trial over all cross-validation instances (a smaller value corresponds to a better fit). Overall, the SU model with cross-option DW by magnitude provided the best fit in the juice-gambling task. Dashed line indicates the average −LL for the best model without DW. b, c, Distributions of the estimated parameters for the utility (b) and PW function (c) using the SU model with DW. The black dashed lines show the medians and a black star indicates that the median of a given distribution is significantly different than 1.0 in b and c and 0.5 in d (two-sided sign test; p < 0.05). The blue dashed line shows the median of the best model without DW (the same medians as in Fig. 6b,c). A blue star indicates that the estimated parameter was significantly different between the best models with and without DW (two-sided sign-rank test; p < 0.05). DW can account for part of the convexity of the utility function because the model with this mechanism is less convex. d, Distribution of estimated DW factors using the SU model with DW. There was a significant DW in favor of the gamble with the larger reward magnitude. e–h, Same as a–d, but for the token-gambling task. Overall, the EU and SU with within-option DW by magnitude models provided the best fit. Moreover, all models with cross-option DW by magnitude were provided worse fits than corresponding models with within-option DW.

