
Figure 1.
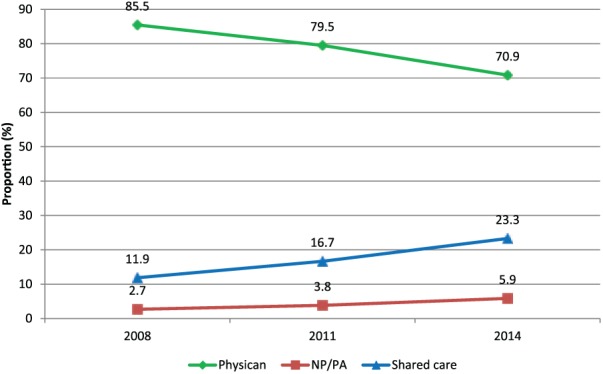
Trends in the proportion of primary care model, Medicare beneficiaries, years 2008, 2011, and 2014.
Data presented were based on Medicare claims data for a 5% national random sample of Medicare beneficiaries who had at least 1 outpatient primary care office visit: for year 2008, for year 2011, and for year 2014. The figure shows the proportion of beneficiaries assigned to each primary care model.
NP, nurse practitioner; PA, physician assistant.