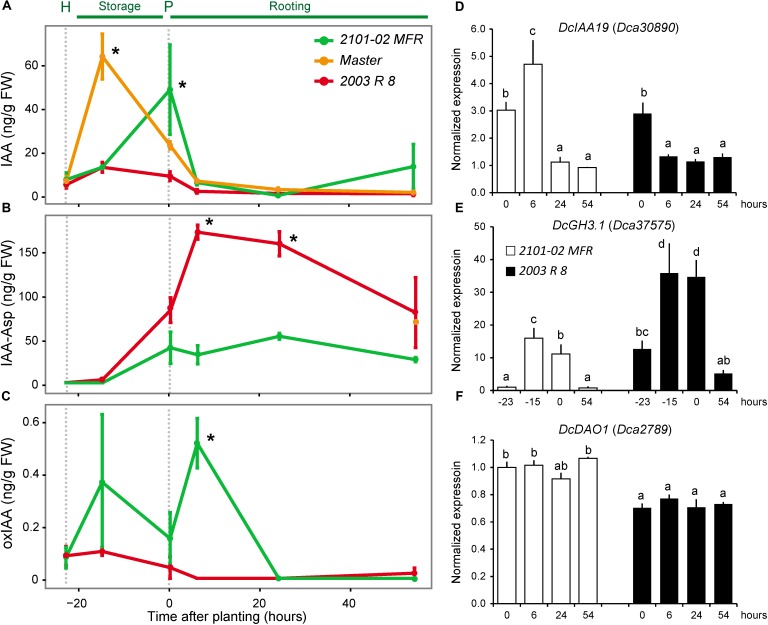
FIGURE 4.
Endogenous levels of several auxin derivatives in the stem cutting base during adventitious rooting and expression of selected genes. (A) IAA, (B) indole-3-acetyl-L-aspartic acid (IAA-Asp), and (C) 2-oxo-indole-3-acetic acid (oxIAA). Average ± standard deviation values are shown at selected time-points: at harvesting time (H; –23 h), during storage at low temperature (–15 h), at planting time (P; 0 h), and during rooting (6, 24, and 54 h). Asterisks indicate significant differences between samples (P < 0.05). (D–F) Real-time PCR quantification of the expression of (D) DcIAA19, (E) DcGH3.1, and (F) DcDAO1 relative to the –23 h dataset in the “2101–02 MFR” cultivar (not shown in the graph). Bars indicate normalized expression levels ± standard deviation. Letters indicate significant differences between samples (P < 0.05).

