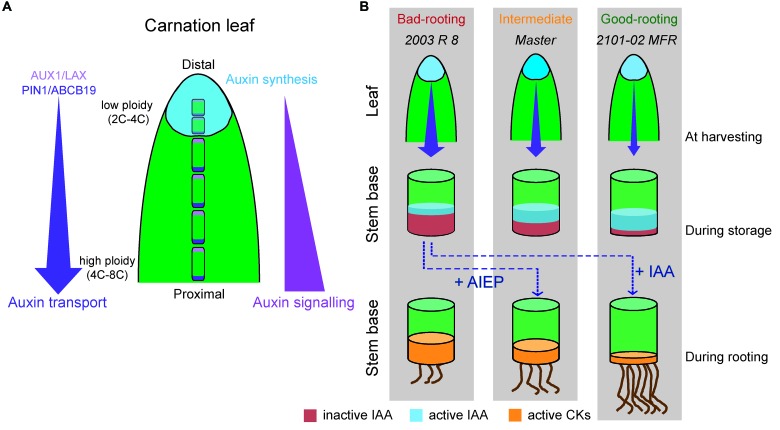
FIGURE 7.
An integrated model of AR formation in carnation stem cuttings. (A) Regulation of auxin homeostasis in stem cutting leaves. Auxin influx proteins (AUX1/LAXs) are depicted in pink; auxin efflux proteins (PIN1 and ABCB19) are shown in purple. Size and ploidy level of mesophyll cells varied between distal (small size and 2C–4C ploidy level) and proximal (large size and 4C–8C ploidy level) leaf regions. The site of auxin synthesis is depicted in light blue. (B) Differences in auxin homeostasis in selected carnation genotypes during rooting of stem cuttings. In the leaf diagrams, the size of the purple arrow indicates the magnitude of the PAT from the leaves and the blue intensity indicates the level of auxin synthesis. In the stem cutting base diagrams, the height of the colored cylinders (red, blue, yellow) indicates the amount of hormone. IAA levels were highest during storage and were quickly downregulated after planting and during rooting. Treatment with AIEP (a well-known inhibitor of GH3 enzymes) results in a higher auxin-to-CK ratio at planting time that enhanced rooting in “2003 R 8” cultivar. Exogenous IAA treatment also enhanced rooting in the “2003 R 8” cultivar.

