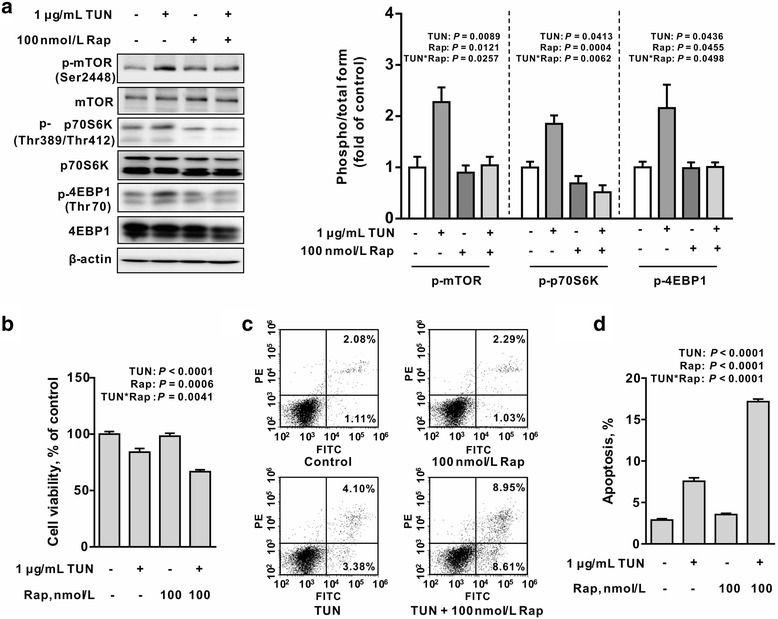
Fig. 5.

Rapamycin enhances tunicamycin-induced cell apoptosis in IEC-6 cells. a Rapamycin blocked tunicamycin-induced mTORC1 signaling activation. IEC-6 cells were treated with or without tunicamycin (1 μg/mL) in the presence or absence of rapamycin (100 nmol/L) for 12 h. Protein abundances for mTORC1, p-mTORC1, p70S6K, p-p70S6K, p-4EBP1, and 4EBP1 were determined by Western blot analysis. The right panel histograms represents the statistical analysis of protein abundance from three individual experiments. Data are expressed as mean ± SEM. b mTORC1 inhibition by rapamycin sensitized tunicamycin-induced apoptosis. Cells were treated without or with tunicamycin (1 μg/mL) in the presence or absence of rapamycin (10 or 100 nmol/L) for 12 h, cell viability was assessed by using of CCK-8 kit. Data are presented as mean ± SEM in percentage compared to the untreatment group, n = 6. c Flow cytometry analysis of apoptosis in IEC-6 cells. Cells treated as in Fig. 4c were stained by Annexin V-FITC/PI and apoptosis was determined by Facs analysis. d Bar chart for apoptosis in tunicamycin and/or rapamycin treated cells. Data are mean ± SEM, n = 3. TUN, tunicamycin; UT, untreatment; Rap, rapamycin
