
Fig. 6.
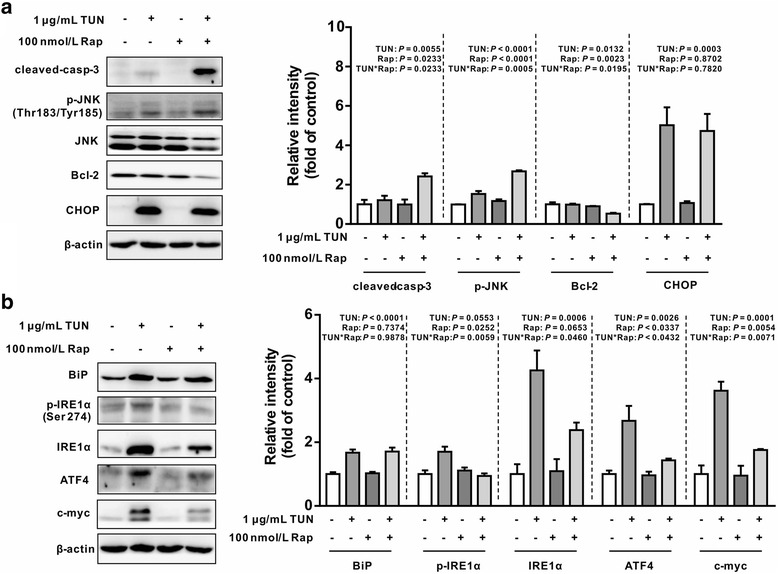
Effect of rapamycin on tunicamycin-induced ER stress markers (a) and (b) apoptosis protein abundance in IEC-6 cells. Cells were treated with or without tunicamycin (1 μg/mL) in the presence or absence of rapamycin for 12 h, protein abundance was determined by Western blot analysis. The right panel histograms at the right side of the bands represent the statistical analysis of protein abundance from three individual experiments. β-actin was used as a loading control. Data are expressed as mean ± SEM. TUN, tunicamycin; Rap, rapamycin; cleaved-casp-3, cleaved-caspase-3