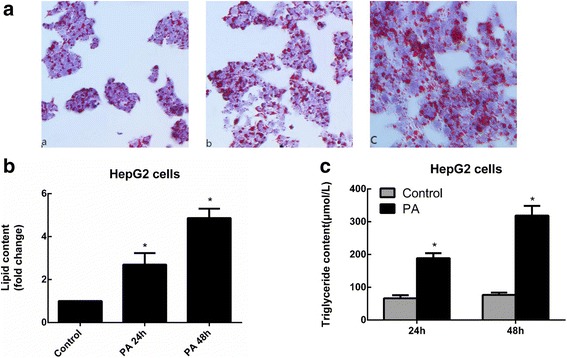
Fig. 1.

Oil Red O staining and TG content in sodium palmitate-treated HepG2 cells. a After incubation with 144 μM PA for different periods of time (a control; b PA for 24 h; and c PA for 48 h), HepG2 cells were stained with Oil Red O and reviewed under an optical microscope. b The intracellular lipid content in each group was quantified. c Cells were treated with 144 μM PA for 24 and 48 h, and TG levels were measured by an enzymatic assay kit. Data are presented as the means±SDs (*P < 0.05 versus the control group)
