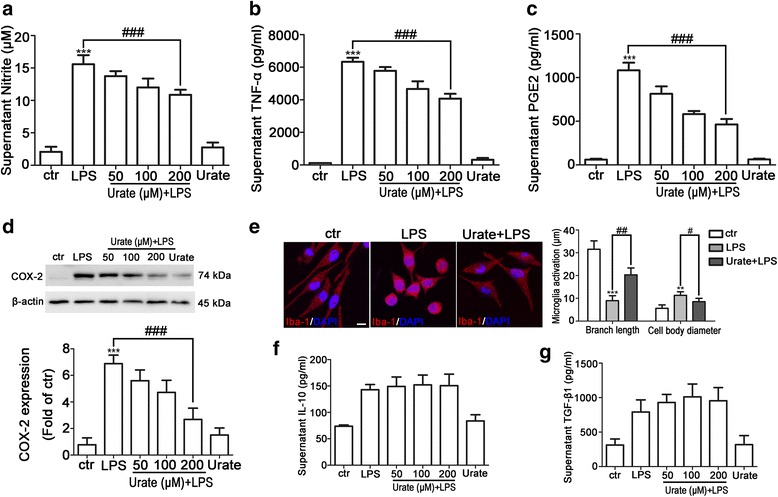
Fig. 1.

Urate inhibits LPS-induced microglia activation in BV2 cells. a–c BV2 cells were pretreated for 30 min with 50, 100, or 200 μM urate followed by 100 ng/ml LPS for 24 h; NO (a, n = 4), TNF-α (b, n = 5), and PGE2 (c, n = 3) levels in the culture supernatant were measured by ELISA. d BV2 cells were pretreated with indicated concentrations of urate and LPS, and COX-2 level was detected by Western blotting (up, n = 4). Protein band intensity was normalized to β-actin and is expressed as fold difference relative to the control group (down). e BV2 cells were pretreated with 200 μM urate followed by LPS, and microglia activation was evaluated by immunofluorescence detection of Iba-1 (red) and cell nuclei were stained with DAPI (blue) (left, n = 3). Branch length and cell body diameter were quantified with ImageJ software (right). Scale bar = 10 μm. f, g BV2 cells were pretreated for 30 min with indicated concentrations of urate followed by LPS for 24 h; IL-10 (f, n = 4) and TGF-β1 (g, n = 3) levels in the culture supernatant were measured by ELISA. Untreated cells served as the control (ctr). Data represent the mean ± SD. **p < 0.01, ***p < 0.001 vs. control group; #p < 0.05, ##p < 0.01, ###p < 0.001 vs. LPS group (one-way analysis of variance)
