
Fig. 6.
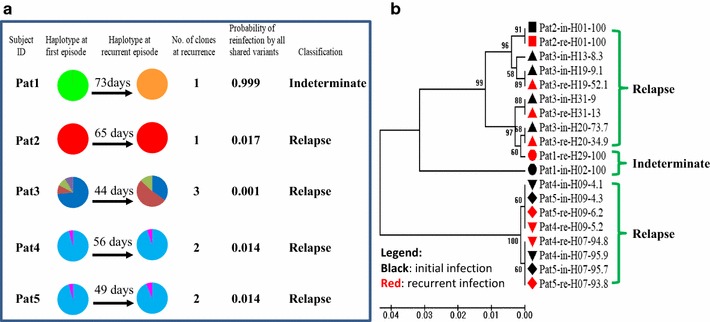
Deep sequencing identification of P. vivax relapse. a Pie chart represents haplotype composition changes between initial and recurrent infections. Each color represents a unique haplotype. Probability of reinfection calculated by population frequency of all shard haplotypes; Classification: P < 10%, relapse; otherwise, Indeterminate (Lin et al. [15]). b Phylogenetic analysis of relapse. Branch labels in black markers are initial infected haplotype; labels in red markers are recurrent infections. Label used patient number followed by haplotype name and frequency of the haplotype within host infection