Fig. 4.

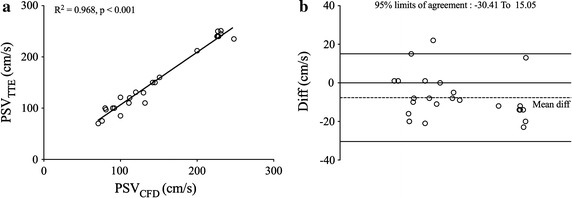
Validation of PSV derived from CFD. Demonstration of PSV and PSP validation. The image a was linear fitting of PSV, and image b was Bland–Altman plot of PSV. The reference line of Bland–Altman plots was mean difference ± 1.96 *SD

Validation of PSV derived from CFD. Demonstration of PSV and PSP validation. The image a was linear fitting of PSV, and image b was Bland–Altman plot of PSV. The reference line of Bland–Altman plots was mean difference ± 1.96 *SD