
Fig. 5.
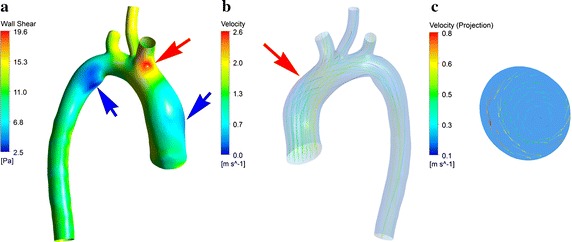
Distribution of PSWSS and streamline. Distribution of PSWSS was demonstrated in image a. Highest PSWSS was marked by red arrow, and lowest PSWSS was marked by blue one. Streamline at peak systolic was shown in image b, and the helical flow was marked by red arrow, and the projection of helical flow at cross section was demonstrated in image c