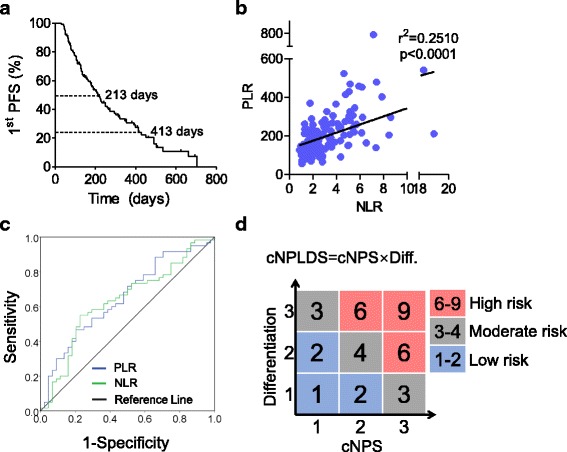
Fig. 1.

Parameter definitions. a Progression-free survival during the first-line chemotherapy (1st PFS) curve for all the 136 patients included in this study. b Correlation analysis between NLR and PLR. c ROC curve for NLR and PLR to determine the cut-off values at the median 1st PFS. d Schematic figures of cNPLDS and risk classifications
