Fig. 3.

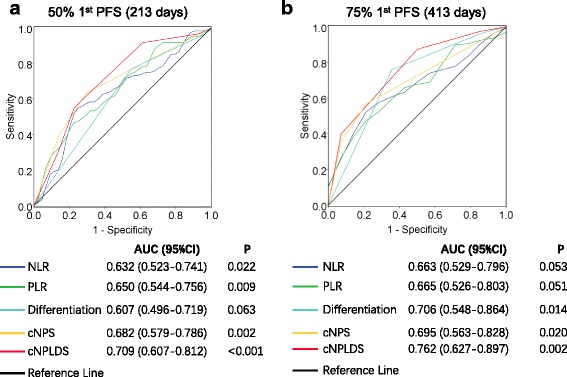
Comparing prognostic prediction priority using ROC curves. ROC curves for histological differentiation, NLR, PLR, cNPS and cNPLDS at (a) the median and (b) the third-quarter of 1st PFS

Comparing prognostic prediction priority using ROC curves. ROC curves for histological differentiation, NLR, PLR, cNPS and cNPLDS at (a) the median and (b) the third-quarter of 1st PFS