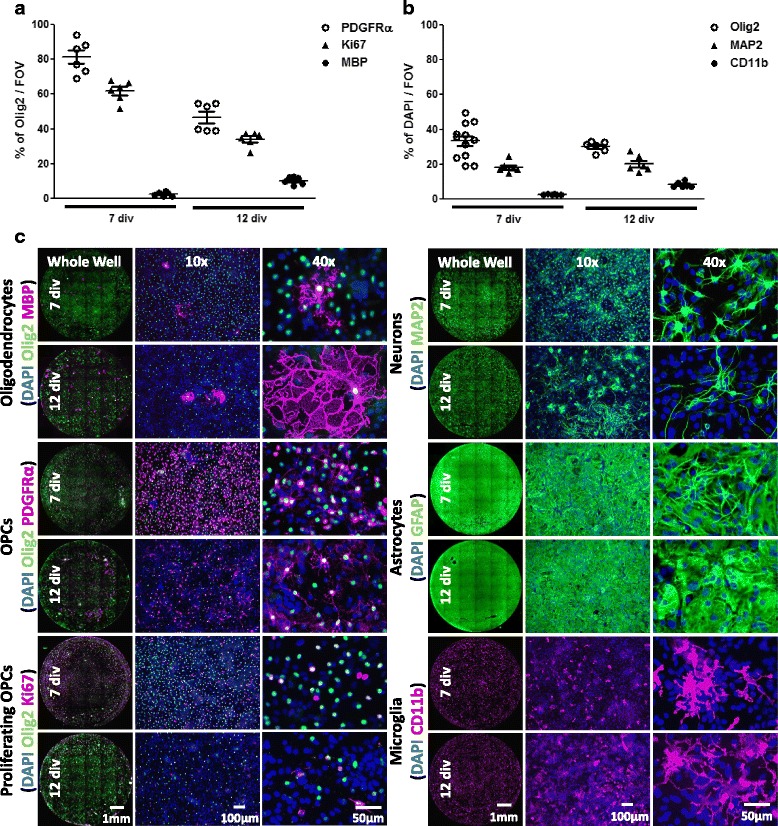
Fig. 1.

Oligodendroglial lineage cell composition in mixed neuron-glia cultures. Immunofluorescence analysis (a) of Olig2+ oligodendroglial cell population for percentage of OPCs (PDGFRα+), oligodendrocytes (MBP+) and proliferating OPCs (Ki67+) and (b) of DAPI+ cells for percentage of oligodendroglial lineage cells (Olig2+), neurons (MAP2+) and microglia (CD11b+) in mixed neuron-glia cultures at 7 or 12 div, n = 6 to 12 wells, representative of two independent experiments. Data are from 4 different experiments depending on timepoint and marker. FOV = field of view = 1 mm2. (c) Representative images of mixed neuron-glia cultures stained for oligodendrocytes (Olig2+MBP+), proliferating OPCs (Olig2+Ki67+), OPCs (Olig2+PDGFRα+), neurons (MAP2+), astrocytes (GFAP+), microglia (CD11b+) and total cells (DAPI+) at 7 and 12 div
