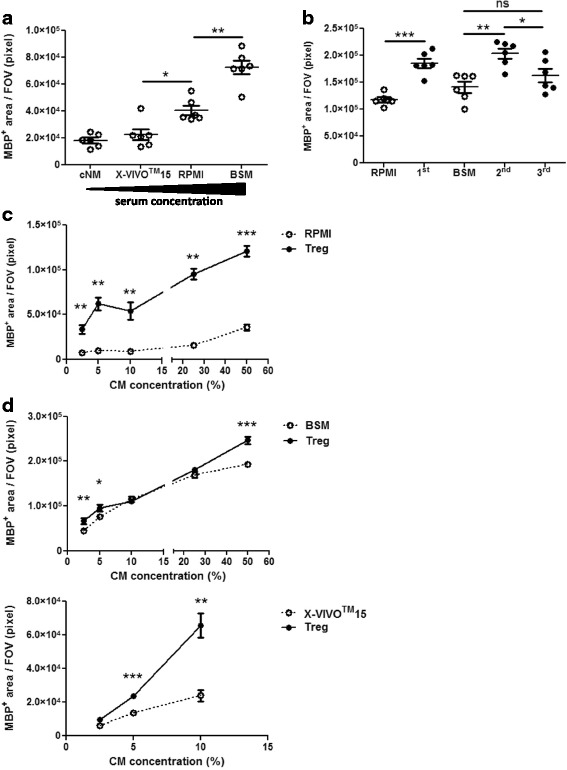
Fig. 4.

Concentration response of Treg-enhanced OPC differentiation. (a) Mixed neuron-glia cultures were treated with 5% of different media used to activate T cells. (b) Mixed neuron-glia cultures were treated with 5% of Treg-conditioned media generated from the 1st, 2nd and 3rd activation or matched medium control (RPMI for 1st and BSM for 2nd and 3rd activation) for 5 days. (c, d) Mixed neuron-glia cultures were treated with 2.5, 5, 10, 25 and 50% of Treg-conditioned media from (c) 1st and (d) 2nd Treg activation or matched medium control (c) RPMI, (d) BSM or X-VIVO™15 as indicated) for 5 days. (a-d) Immunofluorescence analysis of MBP+ area, n = 6 wells and for (d) X-VIVO™15 n = 5 wells, mean +/− SEM, (a) Mann-Whitney test, (b-c) unpaired t-test, (d) unpaired t-test or Mann-Whitney test as appropriate, (*) p < 0.05, (**) p < 0.01, (***) p < 0.001, (a-b) representative of two independent experiments and (c-d) data are from a single experiment. FOV = field of view = 1 mm2
