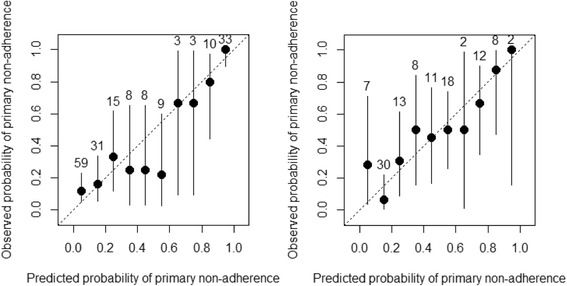
Fig. 2.

Calibration of predicted vs observed probability of primary nonadherence in methotrexate and biologics/tofacitinib test samples. Calibration plot for (left) methotrexate (n = 179, Hosmer–Lemeshow test p = 0.014) and (right) biologics/tofacitinib (n = 111, Hosmer–Lemeshow test p = 0.484). Numbers above each line of calibration plot refer to number of patients in each decile of predicted probability in the test sample. The 45° line indicates perfect calibration
