Fig. 1.

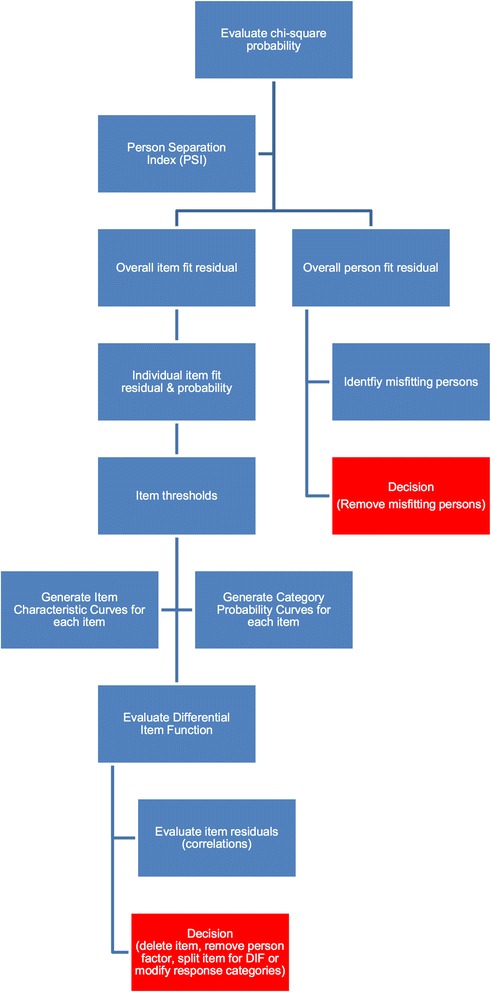
Flow diagram outlining the statistics used in each step of the Rasch analysis. At the red box, the process is repeated until fit to the Rasch model is achieved

Flow diagram outlining the statistics used in each step of the Rasch analysis. At the red box, the process is repeated until fit to the Rasch model is achieved