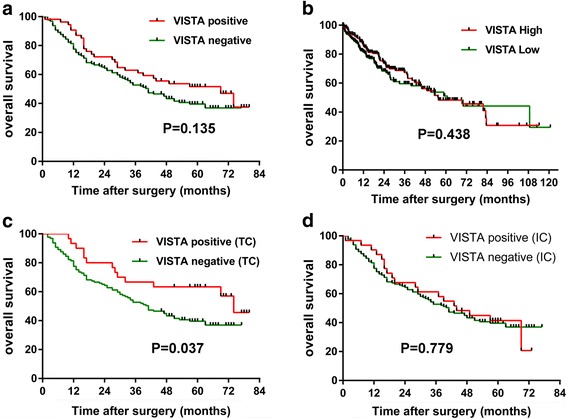
Fig. 2.

Kaplan-Meier curves showing overall survival (OS) of patients with hepatocellular carcinoma (HCC) based on VISTA status. Kaplan-Meier curves of OS in HCC tissue microarray (TMA) cohort (a) and The Cancer Genome Atlas (TCGA) cohort (b) according to VISTA protein and mRNA expression. Kaplan-Meier curves of OS in the HCC-TMA cohort classified on the basis of whether they are positive in tumor cells (c) or in immune cells (d). TC, tumor cell; IC immune cell. VISTA, V-domain Ig suppressor of T cell activation
