Fig. 5.

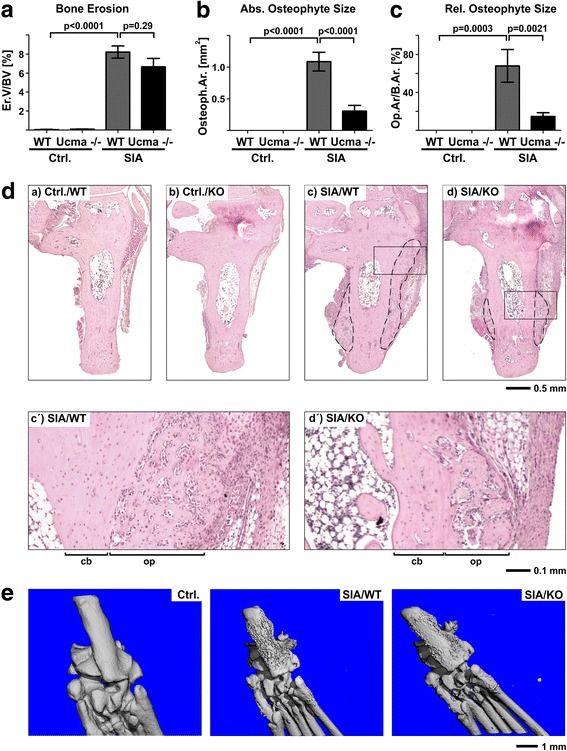
Reduced arthritis-triggered osteophyte formation in Ucma-deficient mice. Histomorphometry at 14 days after serum transfer showing (A) bone erosion (erosion volume per bone volume (Er.V/BV)), (B) maximal absolute osteophyte area (Osteoph.Ar.) and (C) relative osteophyte area expressed as osteophyte area per bone area (Op.Ar/B.Ar) in Ucma-deficient (Ucma−/−) and WT mice with serum-induced arthritis (SIA). D Representative micrographs of the calcaneus (H&E staining) in WT (Ctrl./WT) and Ucma-deficient (Ctrl./KO) non-arthritic controls and in WT (SIA/WT) and Ucma-deficient (SIA/KO) mice with SIA. Dashed line shows osteophytes. (b′, b″, c′, c″) Higher magnification inserts of (b) and (c), respectively. E Representative micro-CT scanning images (plantar view) of hind paws of WT control (Ctrl.), and WT (SIA/WT) and Ucma-deficient (SIA/KO) mice with SIA. Means ± SEM shown; n = 7 or 8 per group. D Composite images of 12–20 individual micrographs, respectively. cb normal cortical bone, KO knock-out, op osteophyte tissue, Ucma Upper zone of growth plate and cartilage matrix-associated protein, WT wild type
