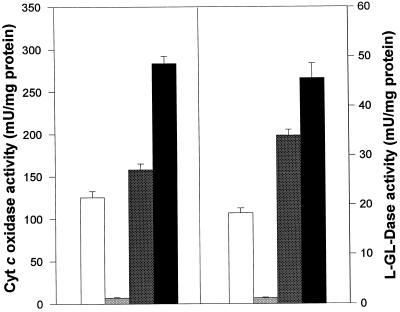
Figure 4.
Distribution of Cyt c oxidase and l-GLD in the subcellular fractions. Cyt c oxidase and l-GLD activities were assayed in homogenate (white bars), the microsomal fraction (light gray bars), the crude mitochondria (dark gray bars), and the pure mitochondrial fraction (black bars). Data represent specific activities for each analyzed fraction.

