. 2018 Mar 12;6(5):1109–1119. doi: 10.1039/c7bm00853h

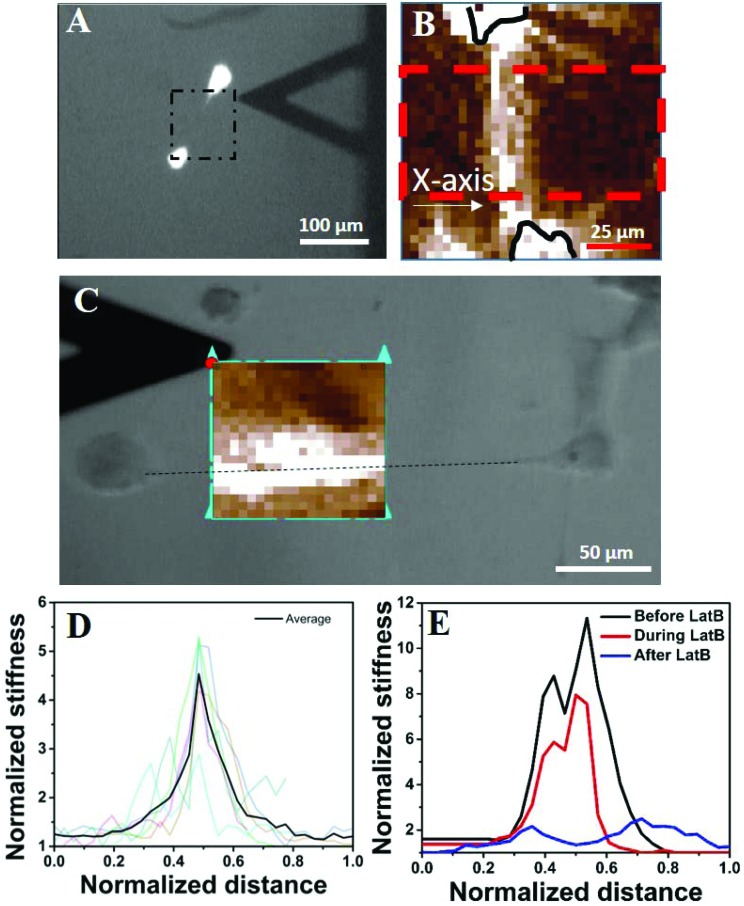
Fig. 5. Cellular traction increases the local stiffness of the substrate. (A) AFM to measure the local stiffness of the gel between two cells. The cells are stained with calcein AM and hence appear bright. The square with a black dashed line represents the area scanned by the AFM tip. One of such representative scanned areas is shown in (B). (B) Represents a typical AFM force map showing two cell bodies (outlined in black solid lines) and the intermediate space. Light colours represent higher substrate stiffness. Stiffness values were averaged over the area marked by a red dashed line and represented in Fig. 3D. (C) The increase in apparent stiffness happens along the straight line joining the protrusions of two neighbouring yet non-touching cells. (D) AFM data for six different cell pairs are shown with light colour lines and their average value is shown using a dark line. The length is normalized with the length of the AFM scan along the X-axis as shown in Fig. 3B and the substrate rigidity is normalized with the basal value of the corresponding substrate as measured by AFM. (E) Shows that upon application of LatB, the increased rigidity (black line) of the PAA gel reduces in a time dependent manner (red line) and finally comes down at the basal value (blue line).

Fig. 5