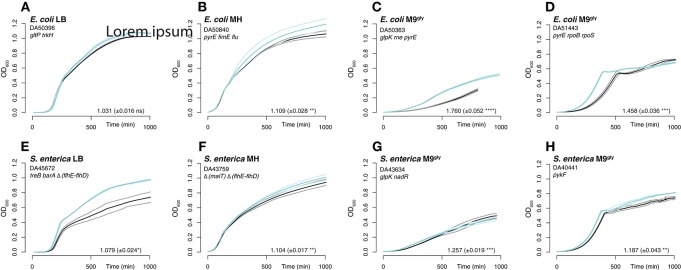
Figure 3.
Growth curves and exponential growth measurements for re-constructed strains. Similar to Figure 1. The re-constructed mutants with the highest measured relative fitness in each media are shown in turquoise and un-evolved wild-type control strains in black. The thick lines are the averages of 2–4 cultures, and the thinner lines the standard deviations.

