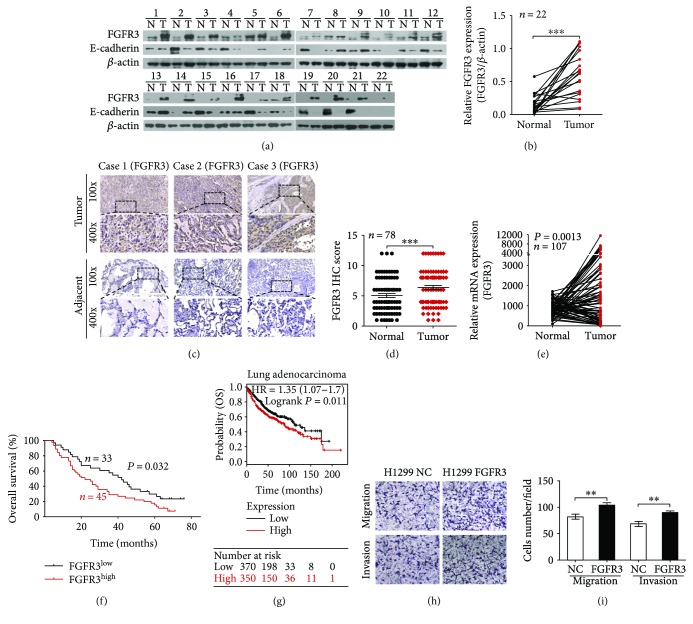
Figure 1.
FGFR3 expression and its role in lung adenocarcinoma. (a) and (b) Western blot analysis of FGFR3 expression in tumor (T) and paired normal (N) tissues from 22 lung adenocarcinoma patients. (c) Representative IHC staining image of FGFR3 in tumors and adjacent noncancerous tissues. (d) Scatter plot of FGFR3 expression (IHC scores) in lung adenocarcinoma and adjacent noncancerous tissues from 78 patients. (e) Analysis of FGFR3 mRNA levels in NSCLC samples from the MethHC database. (f) OS of lung adenocarcinoma patients with low versus high FGFR3 expression. (g) Kaplan–Meier estimates of the cumulative survival rate based on the Kaplan–Meier plotter database. (h) and (i) Representative image of the migration and invasion assay results; the number of migratory and invasive cells is shown (n = 10). ∗∗P < 0.05 and ∗∗∗P < 0.01.

