
Figure 3.
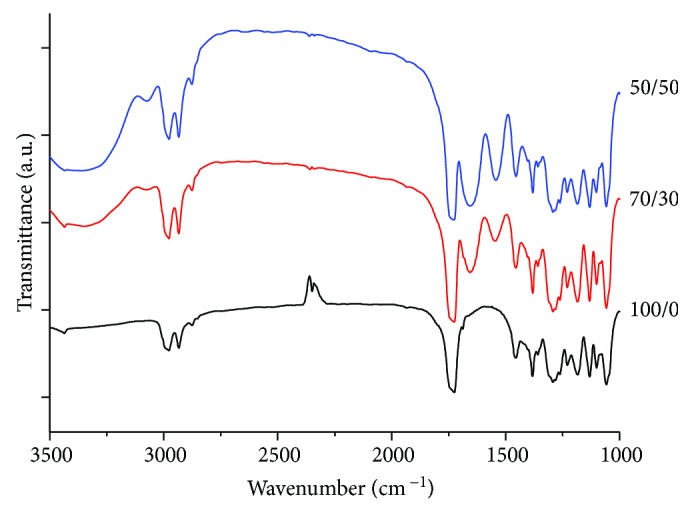
FTIR spectra of the PHB/Coll meshes, plotted in the range 3500–1000 cm−1. Amide bands ascribable to collagen are clearly visible in 70/30 and 50/50 samples, at 3321 cm−1, 3079 cm−1, 1640 cm−1, and 1545 cm−1.
Official websites use .gov
A
.gov website belongs to an official
government organization in the United States.
Secure .gov websites use HTTPS
A lock (
) or https:// means you've safely
connected to the .gov website. Share sensitive
information only on official, secure websites.
FTIR spectra of the PHB/Coll meshes, plotted in the range 3500–1000 cm−1. Amide bands ascribable to collagen are clearly visible in 70/30 and 50/50 samples, at 3321 cm−1, 3079 cm−1, 1640 cm−1, and 1545 cm−1.