Figure 3.

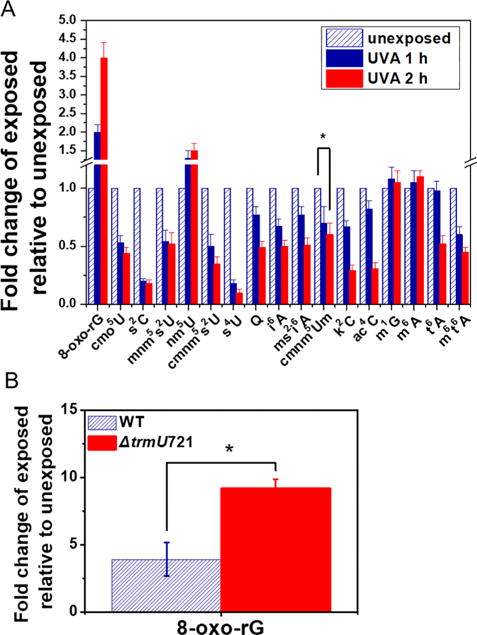
LC-MS analysis of UVA-induced effects on tRNA modifications under in vivo conditions. (A) Changes in tRNA modification levels following UVA exposure of E. coli cells. Each modification is expressed as a ratio of the corresponding signal in the exposed versus unexposed sample. The P values for each modified nucleoside (saving m1G and m6A) as determined by Student’s t test varied by 0.008547 (cmnm5Um, indicated by asterisk) or less. (B) Altered levels of guanosine oxidation following UVA exposure of mnm5s2U-deficient E. coli strain. Fold change in 8-oxo-rG level in tRNA isolated from UVA (3 mJ cm−2, 2 h) exposed cells over unexposed cells is plotted for wild-type (striped bar) and mutant ΔtrmU (white bar). The signal for 8-oxo-rG was normalized to its canonical G in each sample. Data represent mean ± SD values of five biological replicates. Asterisk denotes the P value (0.004137) as determined by Student’s t test.
