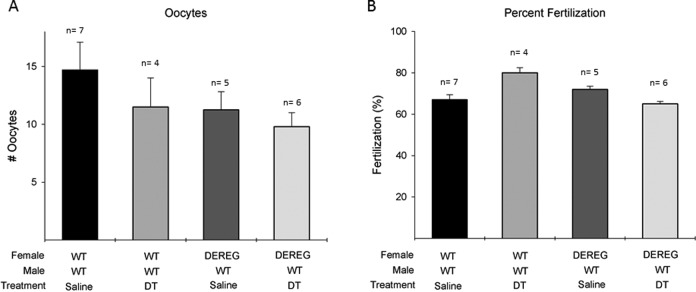
Figure 4.
Equivalent numbers of oocytes and fertilization percentage demonstrate no preimplantation defects. (A) Comparison of oocytes between experimental groups. (B) Comparison of fertilization percentage between experimental groups. Analysis of variance with Tukey test for multiple comparisons was used for analysis.

