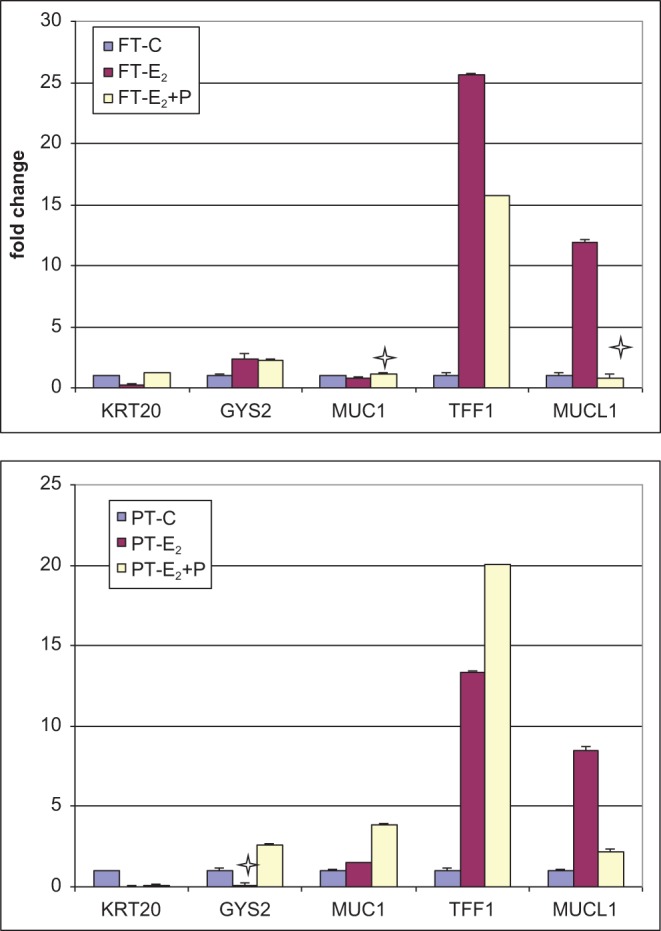
Figure 4.

Quantitative PCR results showing fold change in gene expression relative to the untreated control and normalized to 18 S in full thickness (VEC-FT) and partial thickness (VEC-PT) tissues following exposure to estradiol-17β (E2) and progesterone (P). The x-axis denotes official gene symbols of genes verified by qRT-PCR. Stars show data points where there is a lack of correlation between the gene product concentration and the relative quantification by microarray (15%). FT-C: untreated control VEC-FT tissue; FT-E: VEC-FT tissue treated with 100 nmol/L E2; FT-E + P: VEC-FT tissue treated with 10 nmol/L E2+ 10 nmol/L P; PT-C: untreated control VEC-PT tissue; PT-E: VEC-PT tissue treated with 100 nmol/L E2; PT-E + P: VEC-PT tissue treated with 10 nmol/L E2+ 10 nmol/L P. PCR indicates polymerase chain reaction; qRT-PCR, quantitative reverse transcription polymerase chain reaction.
