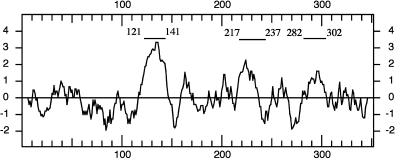
Figure 2.
Hydropathy analysis of the BAT2 protein. Hydropathy profiles were determined using the deduced amino acid sequence of B. napus BAT2 using the Kyte-Doolittle algorithm. Horizontal numbers indicate amino acid positions in the protein sequence, and positive numbers on the vertical scale indicate a hydrophobic region. Three potential transmembrane domains are indicated by horizontal bars.

