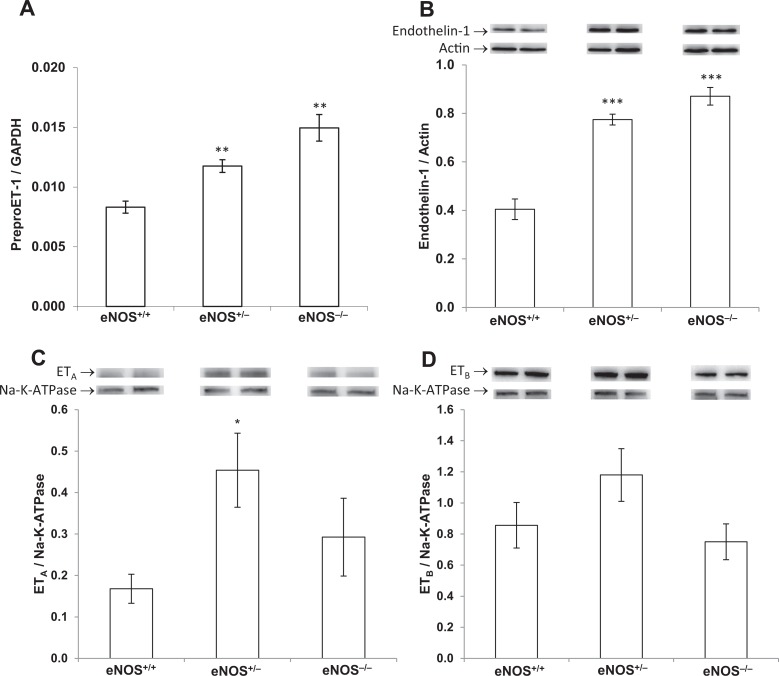
Figure 2.
PreproET-1 mRNA expression (A) and ET-1 (B), ETA receptor (C), and ETB receptor (D) protein production in the placentas from conceptuses of the indicated genotypes. Comparative mRNA expression was determined by real-time quantitative reverse transcription–polymerase chain reaction, and results were normalized to the internal control gene, GAPDH. Protein expression was determined by Western blot and quantified by densitometry normalized to actin. Relative molecular masses are 24 kDa (ET-1), 43 kDa (actin), 48 kDa (ETA), 49 kDa (ETB), and 112 kDa (Na-K-ATPase). Images of representative bands are exhibited. PreproET-1 mRNA and protein expression were significantly increased in eNOS+/− and eNOS−/− placentas compared with eNOS+/+ controls, while ETA was increased in eNOS+/− placentas, and ETB was not significantly affected by eNOS genotype. Data are presented as mean ± SE; *P < .05, **P < .01, ***P < .001; by ANOVA. eNOS indicates, endothelial nitric oxide synthase; SE, standard error; ANOVA, analysis of variance; mRNA, messenger RNA; ET-1, endothelin-1; ETA, endothelin receptor A; ETB, endothelin receptor B; GAPDH, glyceraldehyde 3-phosphate dehydrogenase.

