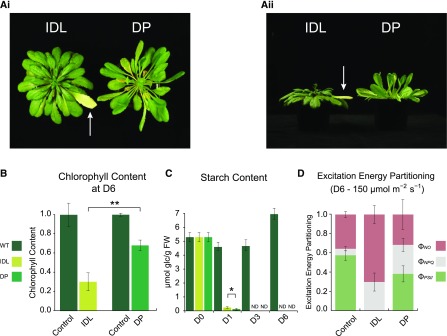
Figure 1.
Phenotypic and physiological analyses of Arabidopsis leaves following the darkening for 6 d of an individual leaf (IDL) and an entire plant (DP). A, Phenotypes of the leaves after 6 d of darkening treatment. The white arrows indicate the IDL. i, Top view; ii, side view. B, Chlorophyll content of leaves sampled at D6, grown under light, IDL, and DP conditions, measured in mg g−1 fresh weight and normalized to their respective wild-type (WT) control samples. Double asterisks indicate a significant (P < 0.01; Student’s t test) difference in chlorophyll abundance between the IDL and DP samples. Error bars indicate se. C, Starch content of sampled leaves grown under light, IDL, and DP conditions, measured in μmol Glc g−1 fresh weight (FW). The single asterisk indicates a significant (P < 0.05; Student’s t test) difference in starch abundance between the IDL and DP samples; ND indicates samples with nondetectable data. Error bars indicate se. D, Excitation energy partitioning at 150 μmol m−2 s−1 (growth conditions) of sampled leaves from control and after 6 d of IDL and DP conditions. Error bars indicate se.

