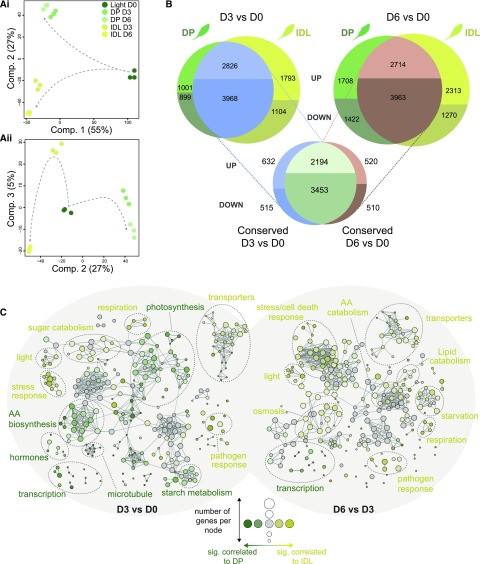
Figure 2.
Transcriptomic analysis of the conserved and diverging responses in Arabidopsis leaves during two darkening treatments. A, PCA was used to reduce the dimensionality of the data and, thus, emphasize similarities and differences within the data set. i, Component 1 (55%) and component 2 (27%); ii, component 2 (27%) and component 3 (5%). B, Differential expression analysis was carried out comparing D3 versus D0 and D6 versus D0 for each darkening treatment. The resulting lists of significantly differentially expressed genes from each treatment were then matched to reveal the level of conservation in transcriptomic response. C, Biological network of enriched GO terms from significantly (P < 0.001) differentially expressed genes in DP versus IDL conditions at D3 and D6. Enriched GO terms associated with either DP (palette of greens) or IDL (palette of yellows) were clustered according to their functional categories. The size of a node is proportional to the number of genes contributing to this node, while the intensity of the color is proportional to the significance (the minimum significance being P < 0.05) of it belonging to a treatment (e.g. dark yellow = strongly associated with IDL, pale green = moderately associated with DP, and gray nodes = overrepresented in the gene subset but not enriched significantly in DP or IDL; the threshold of significance was set at 60%). AA, Amino acid.

