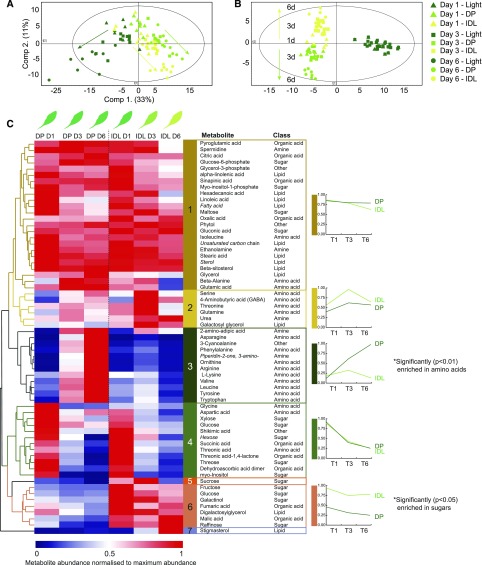
Figure 4.
Metabolic profiling by GC-ToF-MS of leaves during a time course of 1, 3, and 6 d of DP or IDL conditions. A and B, PCA (A; component 1, 33%; component 2, 11%) and supervised OPLS-DA method (B; model with two predictive components [30.2%: 23.4% + 6.8%], three orthogonal components [32.1%], and Q2 [73.8%]), showing the progressive divergence of the respective metabolomes over time. C, Hierarchical clustering (Euclidean distance) of identified metabolites based on their abundance relative to internal standards. Seven clusters were determined. For each cluster (with the exception of clusters 5 and 7), the average metabolite abundance has been plotted to better visualize the changes in abundance that characterize these clusters. Italicized metabolites denote nonconfirmed metabolite identities. Clusters enriched significantly (using an N-1 x2 test) in amino acids (cluster 3) or sugars (cluster 6) are indicated with single asterisks.

