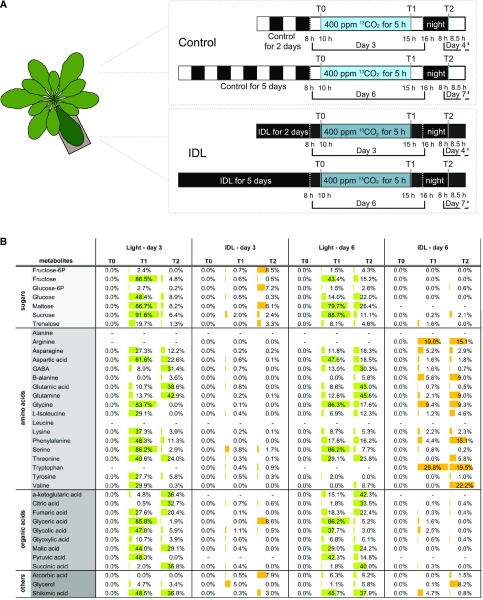
Figure 5.
13CO2 labeling of IDL after 2 and 5 d of darkening treatment. A, Experimental design of the labeling. Five plants with two individually covered leaves (2 or 5 d of treatment) were placed in a custom-made chamber and subjected to 5 h of 13CO2 at 400 µL L−1 and under similar controlled conditions to those in the growth chamber. Both IDL and leaves that remained in the light (Light) were sampled at T0, T1, and T2. B, Summary table of 13CO2 enrichment, expressed as a percentage of the total pool of a given metabolite. Only statistically relevant enrichments are shown (Lindén et al., 2016), and results are means of at least four independent biological replicates. To simplify the illustration of the results, the enrichment in 13CO2 is visualized as data bars, green for light and orange for IDL, and this enrichment was only compared between treatments (i.e. Light-D3 versus Light-D6 and IDL-D3 versus IDL-D6), as the labeling in light samples was so prominent compared with the labeling detected in IDL samples.

