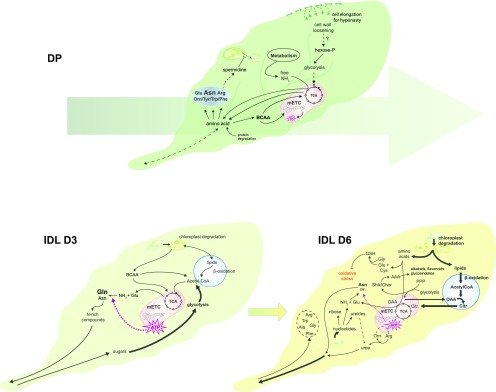
Figure 6.
Model summarizing the different metabolic strategies employed by plants in response to partial or total darkening of the plant. The size and line weigh of the fonts and arrows are proportional to their implication in these metabolic processes. The large arrow behind the leaf in DP conditions depicts the conserved metabolic strategy maintained between 3 and 6 d of darkening. AAA, Aromatic amino acids; Citr, citrate; OAA, oxaloacetate; PPP, pentose phosphate pathway; Shik/Chor, shikimate/chorismate; TCA, tricarboxylic acid cycle.

