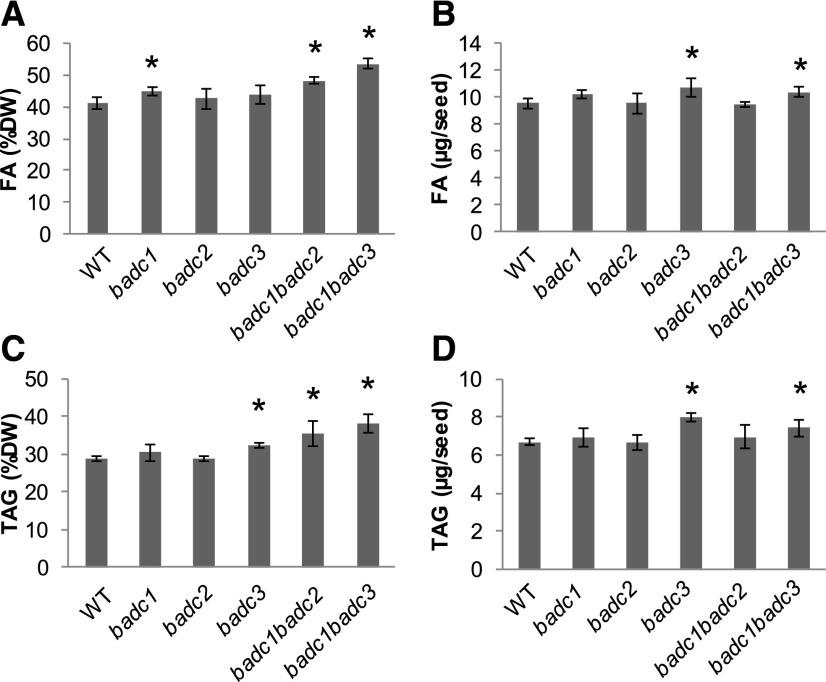
Figure 6.
TFA and TAG increases in badc1 badc2 and badc1 badc3 double mutant seeds. A, TFA contents per dry weight. B, TFA contents per seed. C, Total TAG contents per dry weight. D, Total TAG contents per seed. Asterisks indicate significant differences from the wild type at the level of P < 0.05 as determined by Student’s t test. Values are presented as means ± sd of five biological replicates.

