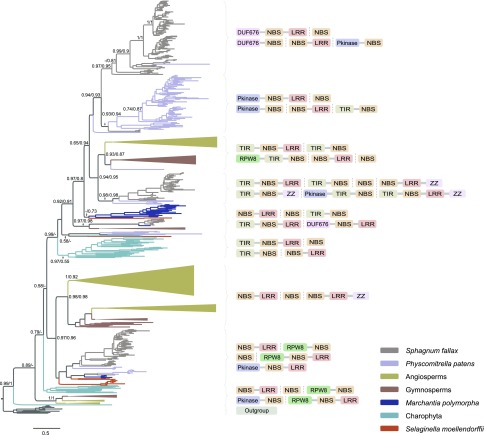
Figure 3.
Phylogenetic analysis of plant R-proteins. The angiosperm and gymnosperm clades are collapsed. The full tree is available in Supplemental Figure S1. The aLRT/SH-like support values are depicted near the selected nodes. The domain organizations are shown near the corresponding clades.

