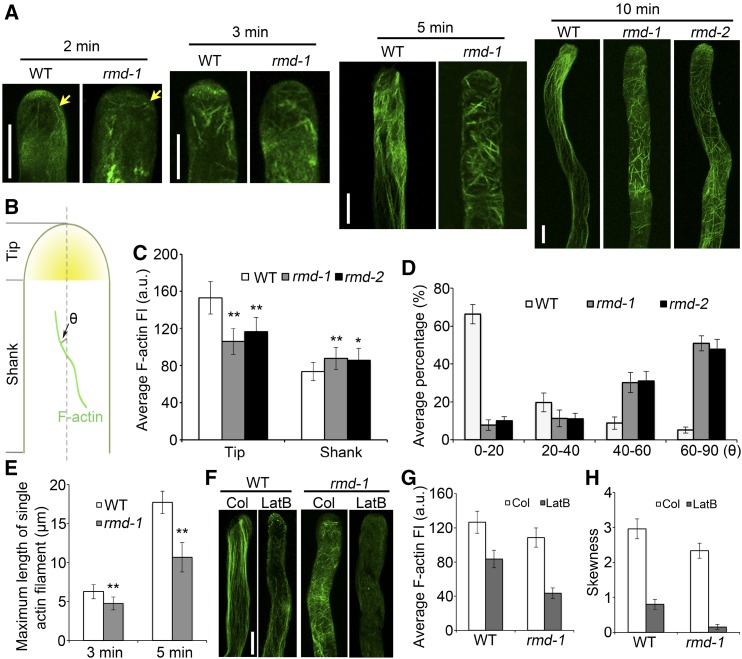
Figure 5.
RMD determines the F-actin array orientation and distribution in rice pollen tubes. A, F-actin organization in growing pollen tubes. Wild-type (WT) and rmd pollen tubes were stained by Alexa Fluor 488-phalloidin 2, 3, 5, and 10 min after germination in vitro. Yellow arrows indicate the types of actin cables initiated in wild-type and rmd-1 pollen tubes. Bars = 5 μm. B, Schematic diagram of actin filament arrays within the tip (apex and subapical zone) and shank region of pollen tubes. θ represents the net angle between the orientation of the F-actin array and the pollen tube growth axis. C, Average F-actin fluorescence intensity (FI) was measured at the tip and in the shank regions of wild-type (n = 32), rmd-1 (n = 36), and rmd-2 (n = 31) pollen tubes (n > 30 of each genotype). a.u., Arbitrary units. D, Average net angle distribution between actin cables and the pollen tube elongation axis. Actin cables visible in the shank of pollen tubes were selected, and the angles formed by each actin cable and the elongation axis were measured. More than 130 actin cables were analyzed for each genotype. Actin filaments of wild-type, rmd-1, and rmd-2 pollen tubes were quantified 10 min after germination in vitro. E, The average maximum length of single tip-associated F-actin filaments was analyzed in wild-type and rmd-1 pollen tubes. Pollen grains of the wild type and rmd-1 mutants were germinated for 3 and 5 min in vitro, respectively. Approximately 100 actin filaments from 20 pollen tubes were monitored for each genotype. F, F-actin response to LatB in wild-type and rmd-1 pollen tubes. Pollen grains were germinated under control (Col; DMSO) and 2 nm LatB conditions for 10 min. Bar = 5 µm. G, Average fluorescence intensity of F-actin in pollen tubes of the wild type (n = 22) and rmd-1 (n = 20) in response to LatB as shown in F. H, F-actin bundling (skewness) analysis in pollen tubes of the wild type (n = 22) and rmd-1 mutants (n = 20) in response to LatB as shown in F. All error bars represent sd of at least three experiments. Student’s t test: *, P < 0.05 and **, P < 0.01.

