Figure 8.
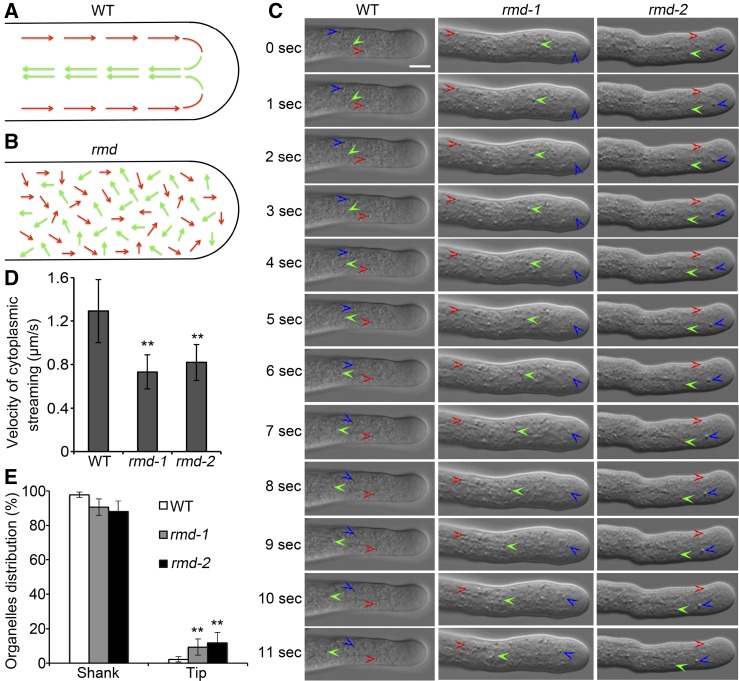
The pattern and velocity of cytoplasmic streaming are altered in rmd mutant pollen tubes. A and B, Schematic representations of cytoplasmic streaming patterns in wild-type (WT; A) and rmd (B) pollen tubes (Supplemental Movies S1–S3). Red and green arrows represent the directions of cytosolic organelles moving acropetally and basipetally, respectively. C, Single frames at 1-s intervals are shown (Supplemental Movies S1–S3). Three independent cytosolic organelles that showed continuous movement are labeled with three different colored arrowheads (red, green, and blue) in wild-type, rmd-1, and rmd-2 pollen tubes. Bar = 5 μm. D, The velocity of cytoplasmic streaming was reduced significantly in rmd-1 pollen tubes. Only the cytosolic organelles with continuous movement were selected for velocity analysis. More than 90 organelles from 15 pollen tubes of each genotype were measured. E, Distribution of organelles at the tip and in the shank of wild-type (n = 26), rmd-1 (n = 23), and rmd-2 (n = 21) pollen tubes. All visible organelles in whole tubes were counted. All error bars represent sd of at least three independent experiments. Student’s t test: **, P < 0.01.

