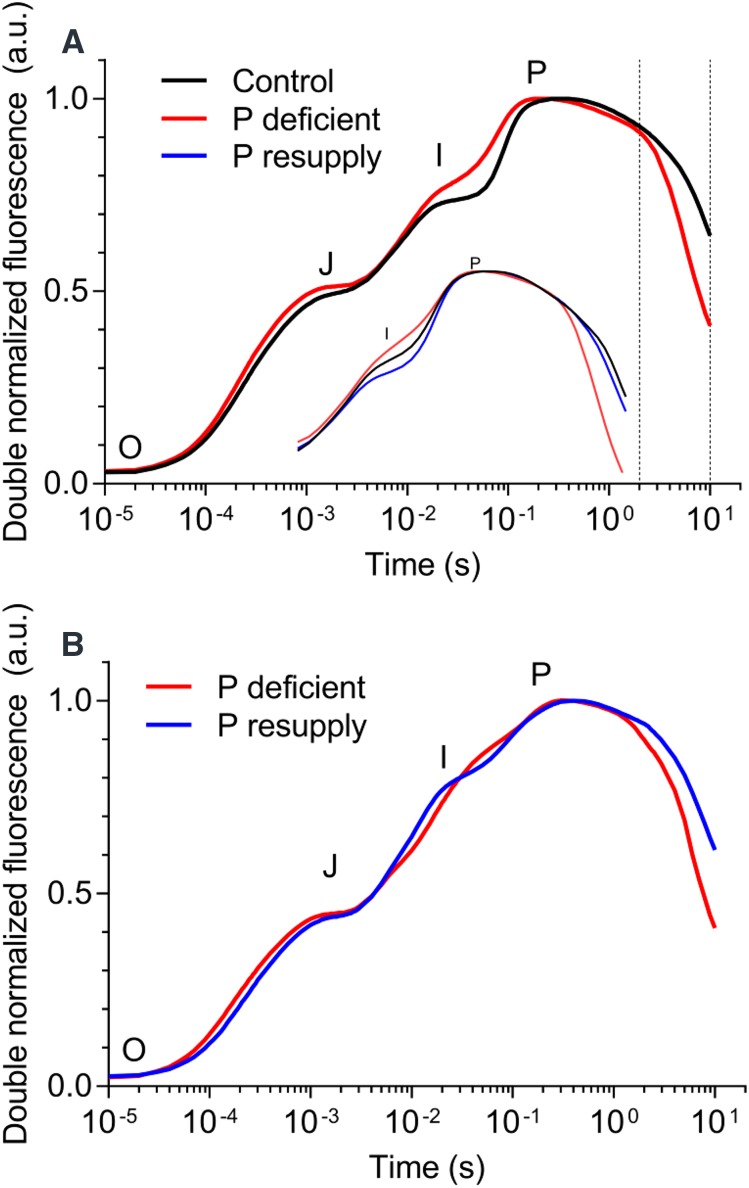
Figure 2.
OJIP transients recorded from the youngest, fully expanded barley leaves. A, Main plot. Transients were recorded just before P resupply at 21 DAP. The inset shows transients recorded 7 d after P resupply at 28 DAP. The slope of the quenching curve was calculated between the two dashed vertical lines (between 2 and 10 s). B, Transients recorded for P-deficient leaves immersed in Milli-Q water (P deficient) or P solution (P resupply) for 60 min. All transients were averaged (A, n = 5; B, n = 4, each with more than four technical replicates) and doubled normalized between F0 and Fm. A.U., Arbitrary units.

