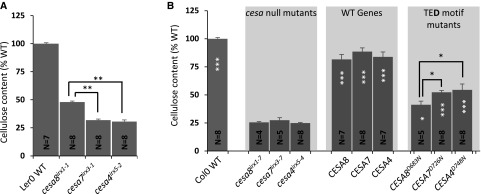
Figure 1.
Cellulose content of the plants with point mutations in the secondary wall CESA genes. A, Data for three cesa mutants, cesa8irx1-1 (D683N), cesa7irx3-1 (W859STOP), and cesa4irx5-2 (W995STOP). B, Secondary wall CESA T-DNA null mutants (cesa8irx1-7, cesa7irx3-7, and cesa4irx5-4) were transformed with wild-type (WT) genes (CESA8, CESA7, and CESA4, respectively) or TED motif Asp-to-Asn mutants (CESA8D683N, CESA7D726N, and CESA4D748N, respectively). Measurements were taken from single plants at the T1 stage. N refers to the number of individual transformants analyzed. Cellulose content is expressed as a percentage of the wild-type value. Error bars indicate se. Significance levels from univariate ANOVA are indicated for comparison between the genotype and the background mutant (white asterisks inside each bar) or between particular genotypes (black asterisks and lines above the bars): ***, significant at 0.001; **, significant at 0.01; and *, significant at 0.05.

