Figure 7.
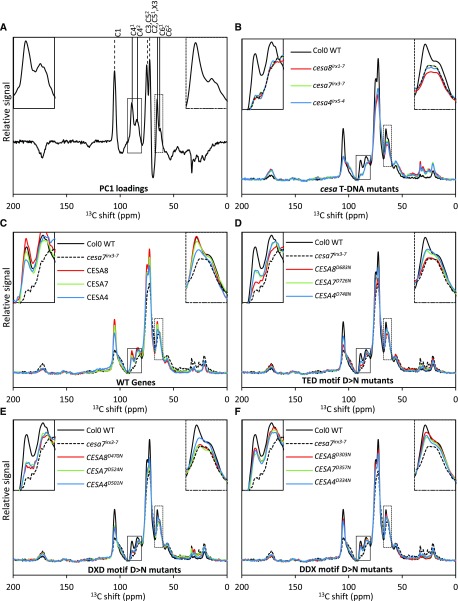
NMR analysis of the plants containing an Asp-to-Asn mutation in the DDX, DXD, and TED motifs of secondary wall CESAs. A, Loadings for PC1 of the PCA that accounts for 89% data variability. B to F, ssNMR data for 16 genotypes. For each genotype, stem powder from up to 36 T2 plants (one selected line) was analyzed. Each graph shows the total signal-normalized individual spectra for the five groups of genotypes. Col-0 wild-type (WT) and cesa7irx3-7 data are repeated in C to F for comparison. The positions of cellulose peaks are indicated by vertical lines above the peaks in A. In each graph, the inset at top left shows the C4 peak region (80–93 ppm), while the inset at top right shows the C6 peak region (60–67 ppm).

