Figure 6.
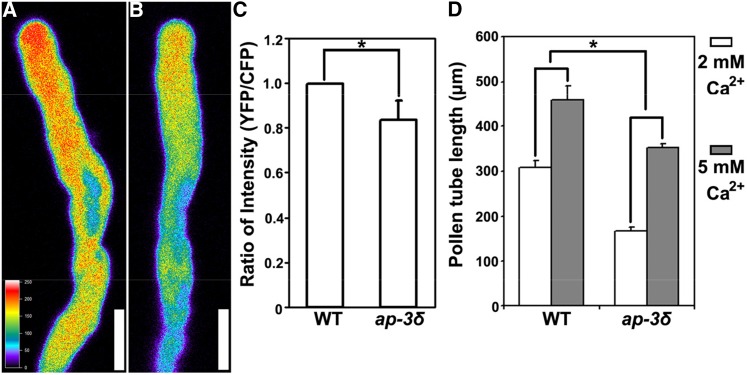
AP‐3 loss-of-function compromises the tip‐focused Ca2+ gradient. A and B, CLSM images of pollen tubes expressing the Ca2+ sensor YC3.6 in the wild type (A) and in ap-3δ (B). Images are representative of 20 pollen tubes for each genotype. Cytosolic Ca2+ levels were calibrated as described in “Materials and Methods” and pseudocolored according to the scale at the left. Bars = 10 μm. C, Quantification of fluorescence intensity as the ratio between YFP and CFP signals. Results are means ± sd (n = 20). The asterisk indicates a significant difference (Student’s t test, P < 0.01). D, Pollen tube length after 4 h of germination in medium containing 2 or 5 mm Ca2+. Results are means ± sd (n = 100). The asterisk indicates significantly different responses of pollen tube growth upon increased exogenous Ca2+ levels (Student’s t test, P < 0.01). WT, Wild type.

