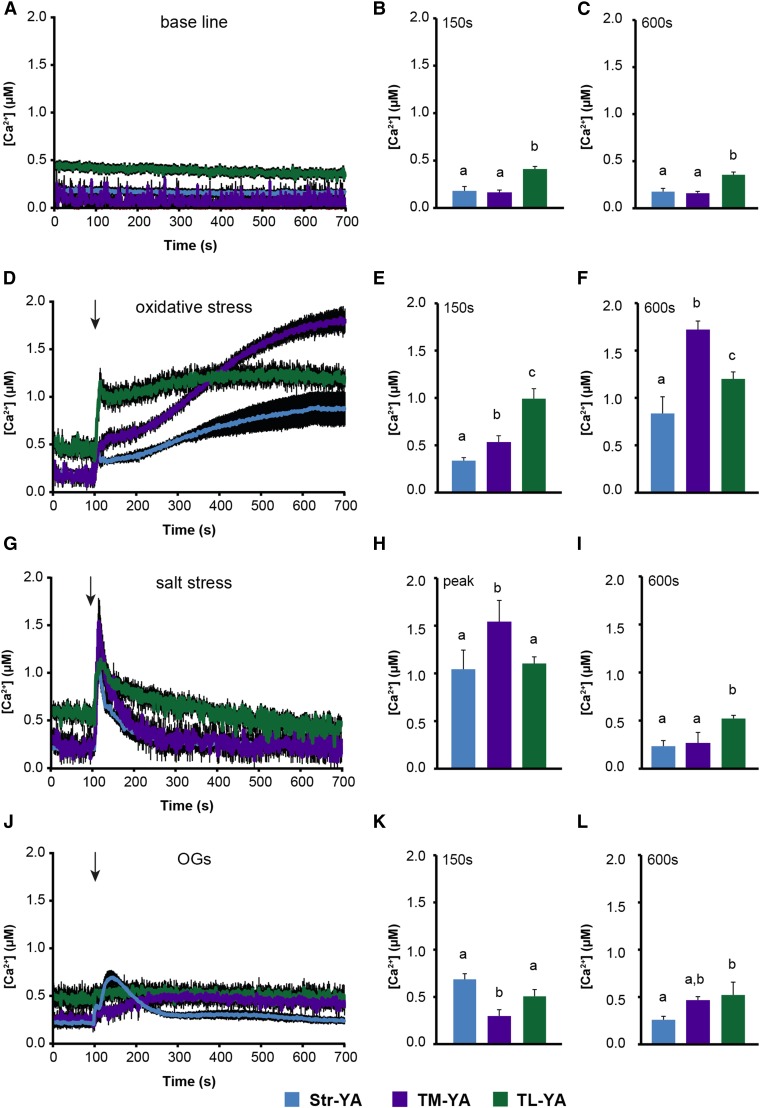
Figure 4.
Monitoring of subchloroplast free [Ca2+] in Arabidopsis cell suspension cultures in response to environmental stimuli. Ca2+ measurements were conducted in Str-YA (blue traces), TM-YA (violet traces), and TL-YA (green traces) lines. A to C, In resting conditions. D to F, In response to 10 mm H2O2. G to I, In response to 0.3 m NaCl. J to L, In response to 20 µg mL−1 OGs. In A, D, G, and J, data are presented as means ± se (black shading) of 15 traces obtained from 15 aliquots of suspension-cultured cells derived from five independent growth replicates. Arrows indicate the time of stimulation (100 s). B, C, E, F, H, I, K, and L show statistical analyses of Ca2+ levels recorded in the different transgenic lines at two different time points: after 150 s (B, E, and K) and 600 s (C, F, I, and L). In H, the maximum [Ca2+] (at the peak) is reported. Bars labeled with different letters differ significantly (P < 0.05, Student’s t test).

