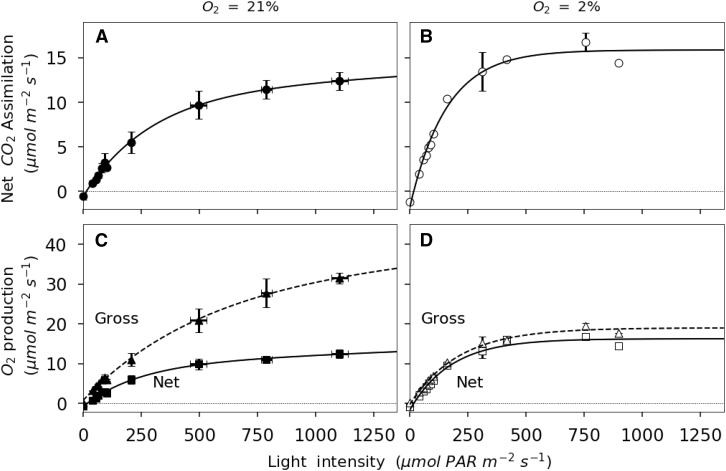
Figure 1.
Light response of net CO2 assimilation and NOP for French bean leaves exposed to 21% O2 (black symbols) or 2% O2 (white symbols). A and B, Light responses of net CO2 assimilation. C and D, Light responses of NOP. Nonrectangular quadratic curves are represented by solid lines for net fluxes and by dashed lines for GOP. Errors bars represent se for n = 3.

